
Lifetime Optimization
Ensure wind turbine lifetime with windPRO optimization
Smart lifetime optimization with windPRO
Optimize curtailment schemes to achieve desired fatigue lifetime with minimum production loss.
The challenge
Maximize wind park performance while ensuring that fatigue lifetime is achieved:
- in all conditions
- regardless of climate
- and wake added turbulences from neighboring wind parks

windPRO’s Lifetime Optimizer helps you
Design smart, compliant curtailment plans.
Account for wake-induced turbulence (internal & external).
Minimize AEP loss while extending turbine lifetimes.
Common limitations
- Restricted available land
- Noise and shadow flicker regulations
- Pre-defined turbine locations (e.g. repowering)
The risk?
Disregard good wind farm layouts due to unexplored curtailment control.
The solution
Get optimal curtailment schemes with windPRO.
Protect turbines from excessive fatigue damage, maximize energy output and financial return.
Real-world scenarios
Pre-construction
Site description: We are constrained by a tight layout due to many environmental constraints but want to place seven new turbines along a height contour. There are already four existing turbines in the area.
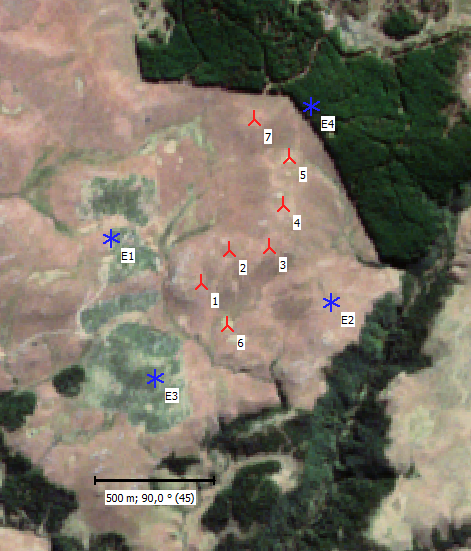
Scenario 1
Optimize for 20-year lifetime in a constrained site
Introduction: This initial evaluation demonstrates the lifetime optimization tool using standard settings and neighbour turbine interactions. The analysis assumes no prior consultation with existing turbine owners. Both new and existing wind turbines share identical configurations:
- WTG design class: IIB
- Desired lifetime: 20 years for both new and existing turbines
- Sensors: Blade root bending moments (x- and y-axis)
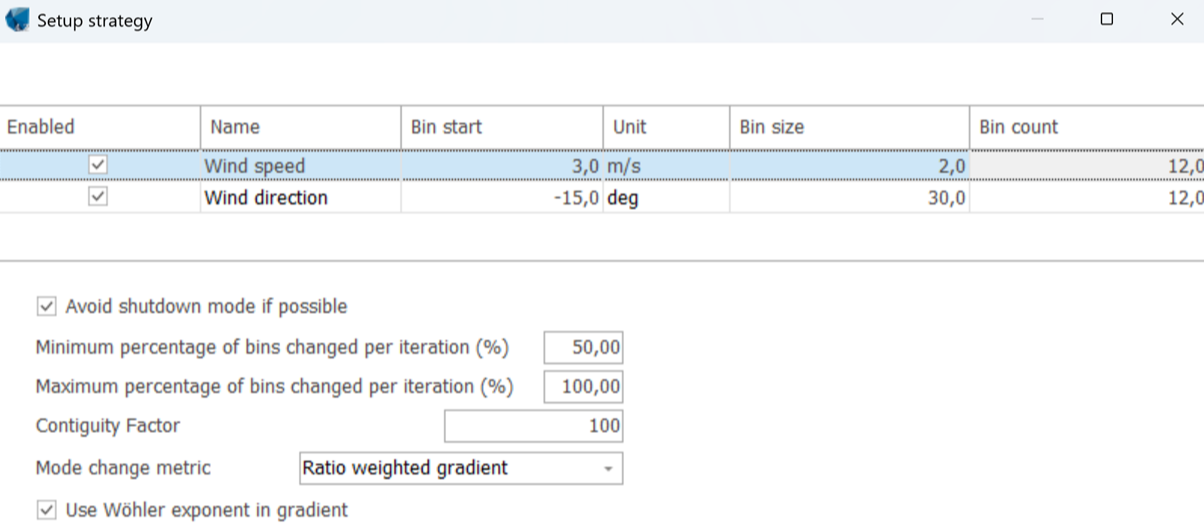
- Nr of modes per turbine: 4 + Shutdown
- Binning:
- Wind speed: Start 3 m/s, bin size 2 m/s, 12 bins
- Wind direction: Start -15°, bin size 30°, 12 bins
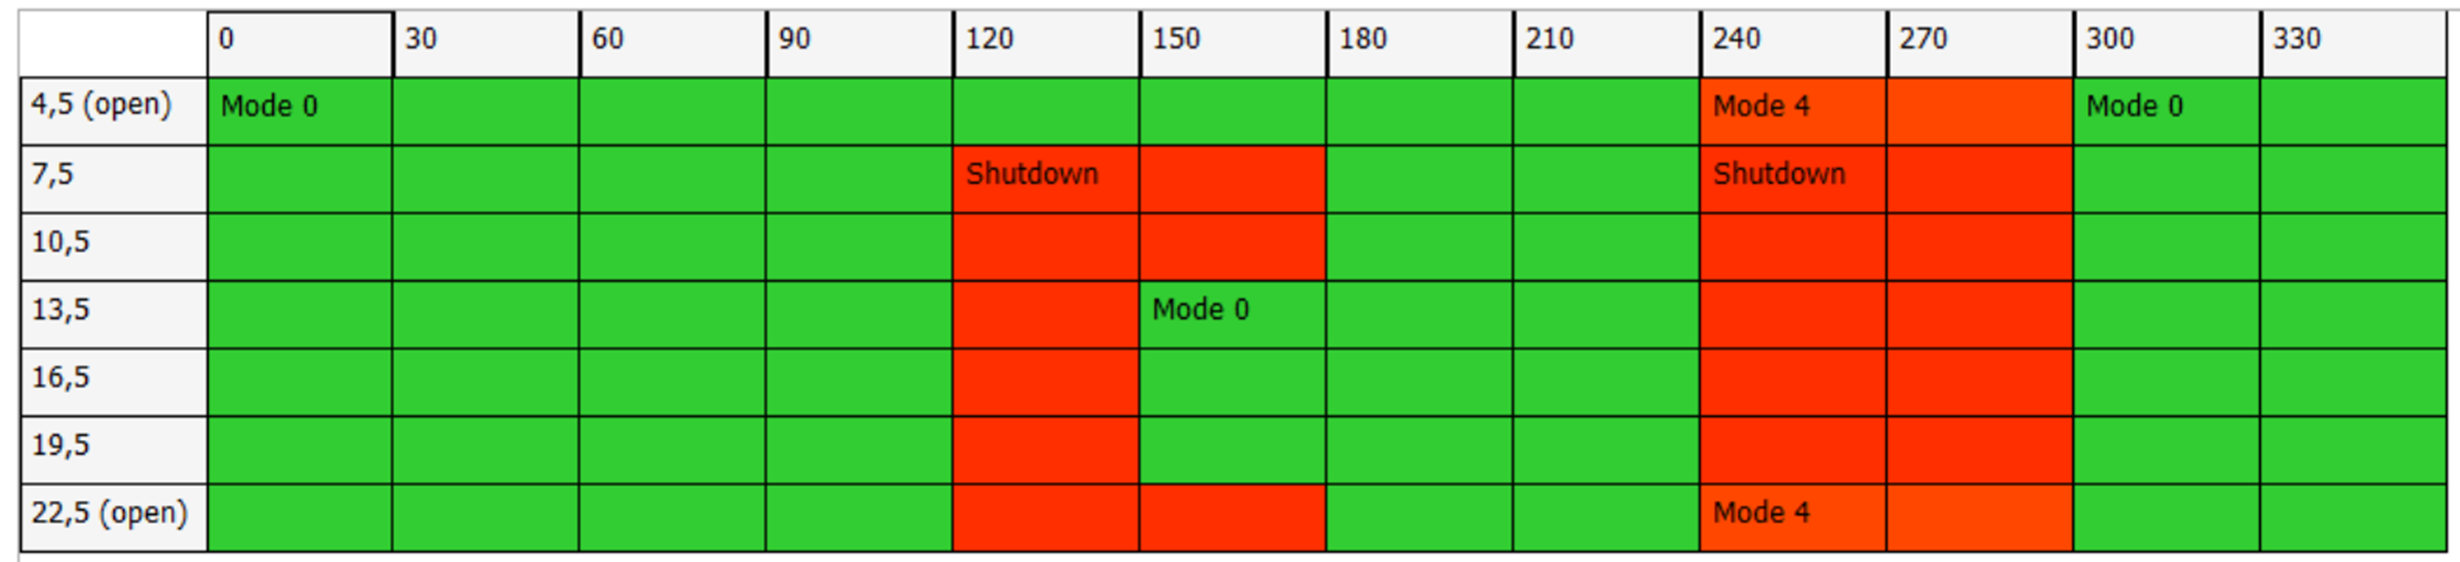
Results
A new perspective on production loss
Implementing the optimized curtailment strategies resulted in an annual energy production (AEP) loss of 6.9% and 10.4% for the planned turbines (see Figure 1).
This decrease in yearly energy output is a direct consequence of the operational limitations required to achieve the desired turbine lifespans. Of all the turbines studied, Turbine 3 was the most affected, experiencing a 60% reduction in AEP after curtailment (see Figure 2).
However, considering the total energy output over the intended 20-year lifetime presents a different perspective: on average, the new turbines are expected to generate 13.1% more total energy over 20 years.
This increase results from eliminating the number of turbine years with zero energy production, which could be expected to occur due to limited fatigue life without applying the curtailment schemes. Alternatively, in a more drastic scenario, the new layout would not have received accreditation at all, meaning that not a single watt-hour of energy would be produced.
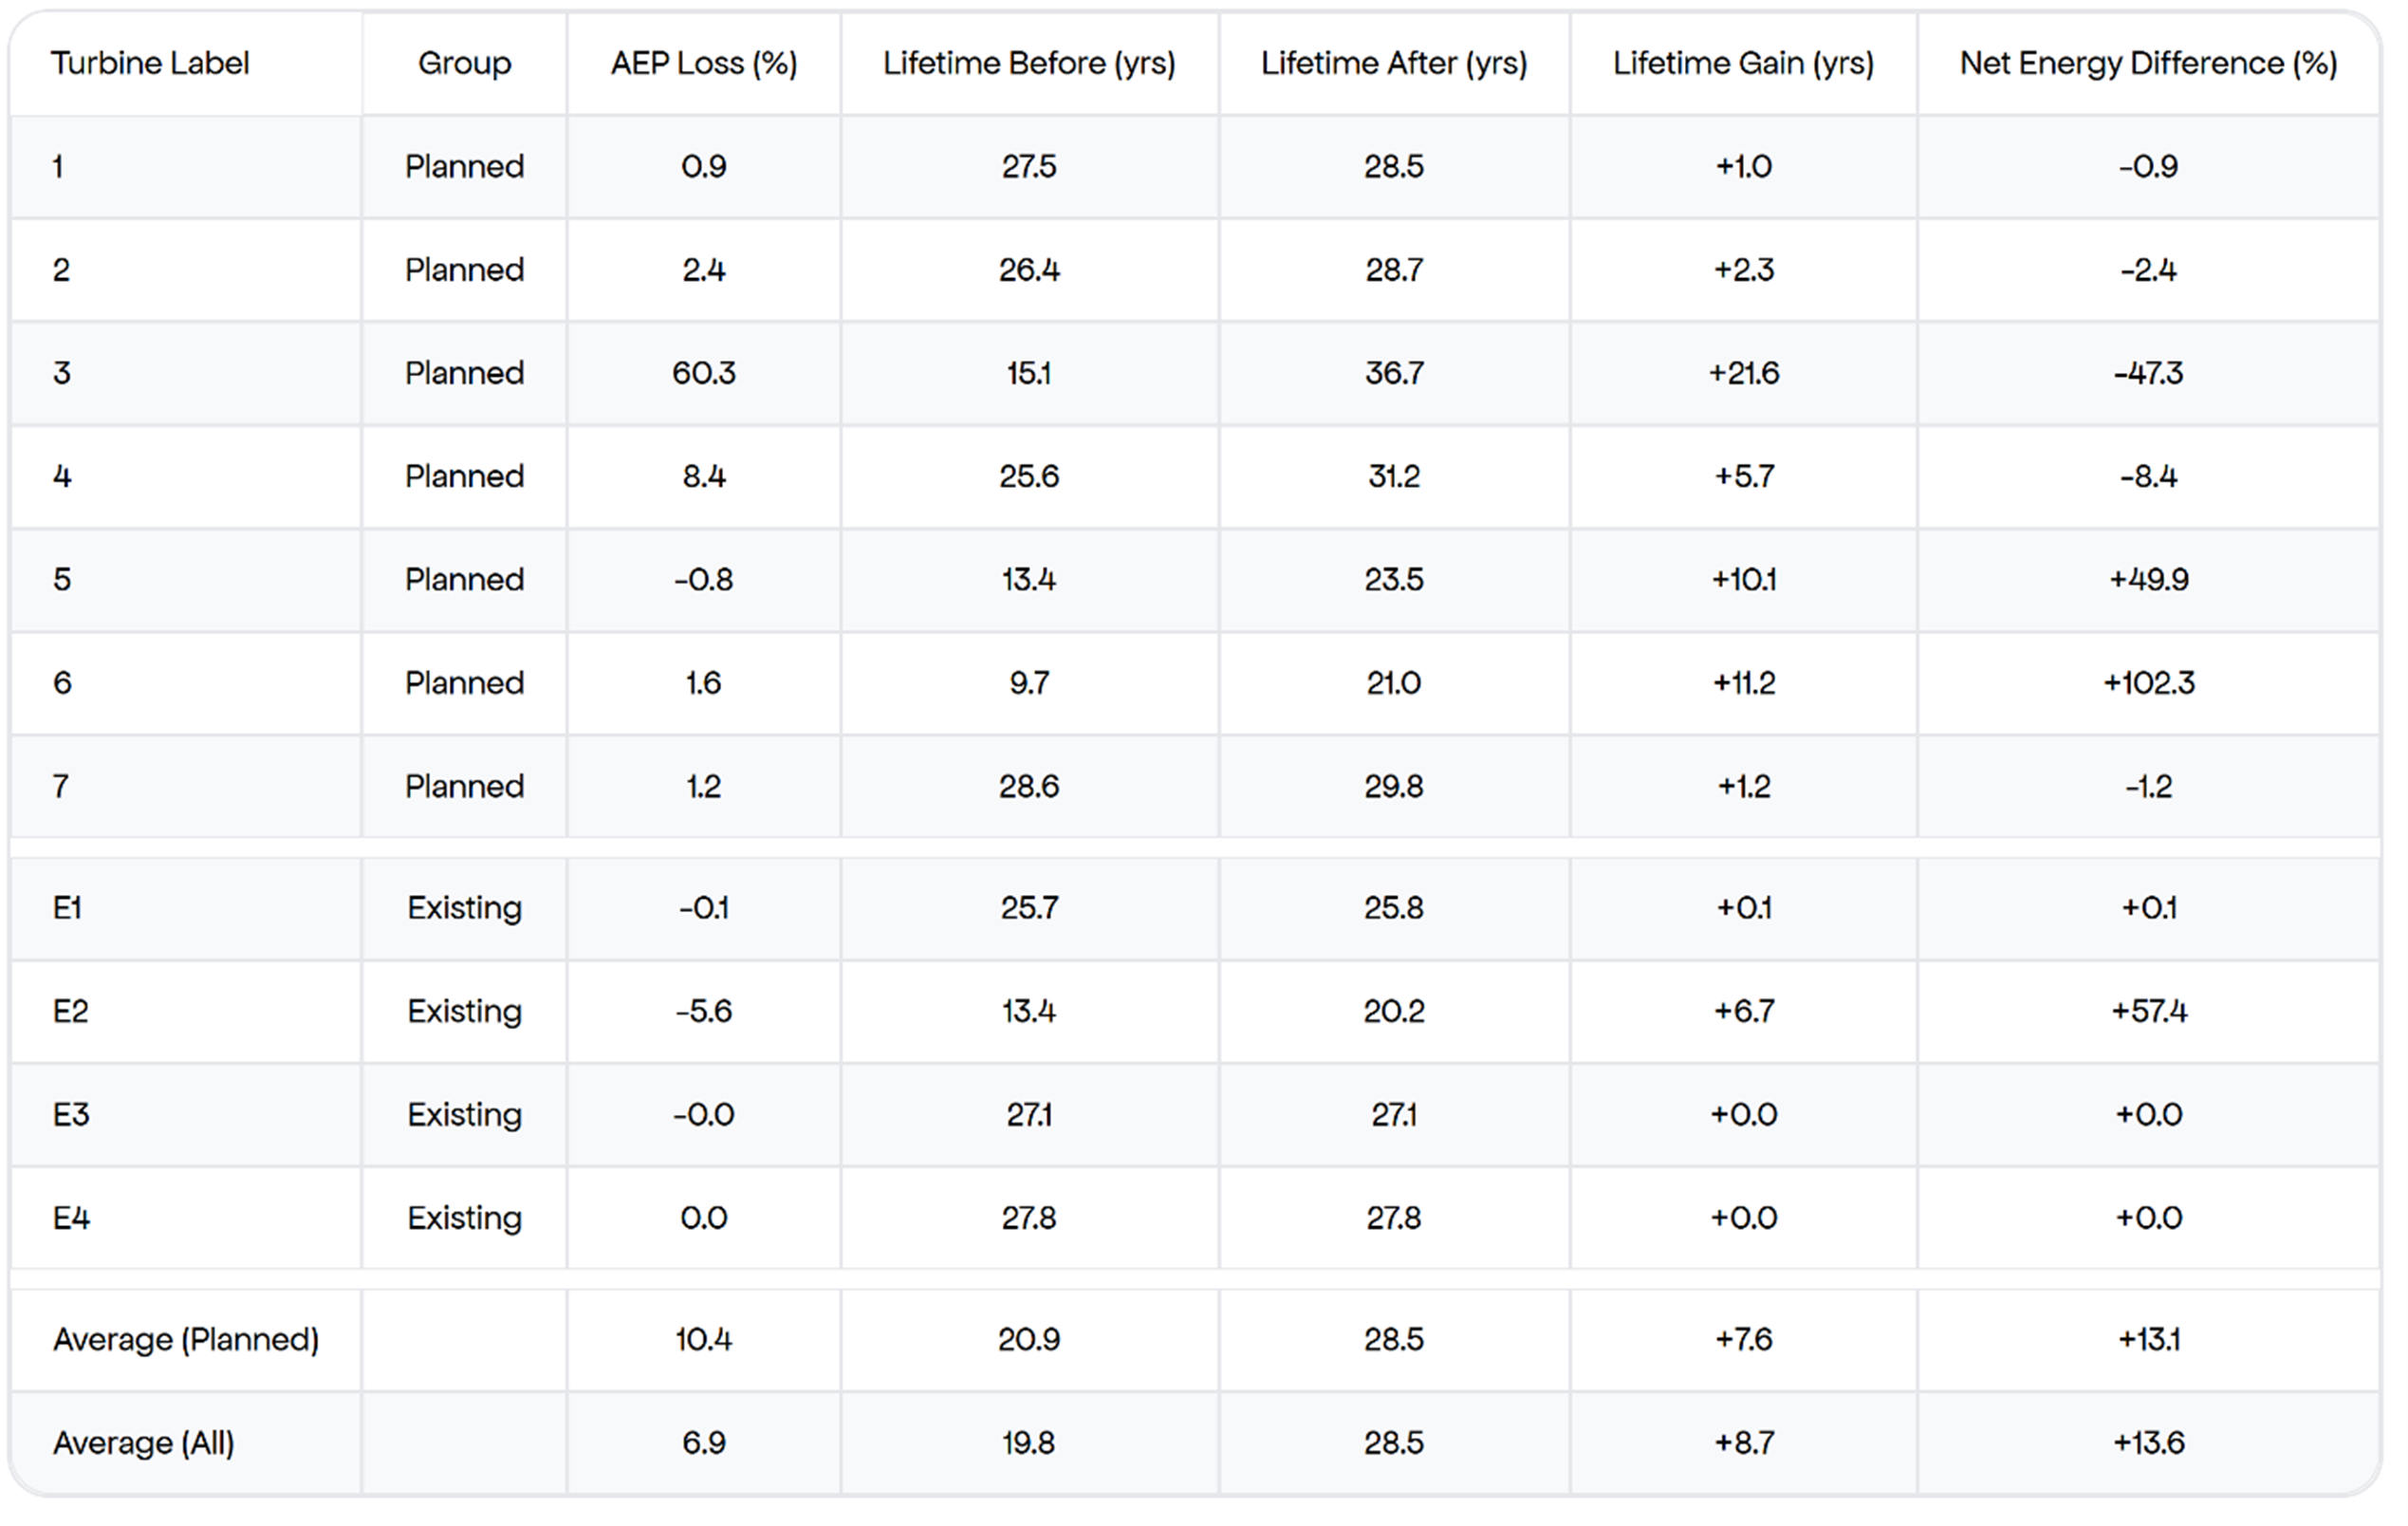
Over 28 years of potential loss
However, the story does not end with annual energy losses. A closer look at the lifetime calculations reveals that for some turbines—specifically turbines 3, 5, 6, and E2—there was a combined shortfall of 28.5 years in achieving the targeted 20-year fatigue lifetime.
In these cases, the turbines would not be able to operate for the full desired period, resulting in zero energy output during the years they fall short. This represents a substantial loss in potential energy production.
Net energy gain of 13.6%
When shifting the focus from annual output to total lifetime energy production, the picture changes significantly. Rather than a net loss, the optimized curtailment strategy leads to an average energy gain of 13.6% across the new turbines.
Important to note
The extended lifetimes are based solely on fatigue calculations according to IEC standards. In reality, other factors such as blade erosion and general wear and tear will likely reduce the actual operational lifetime.
Nonetheless, these results highlight that focusing only on annual energy production losses can be misleading. The lifetime optimizer’s recommendations, while reducing yearly output, can significantly increase the total energy produced over the turbines’ lifespans, provided that other lifetime-limiting factors are managed appropriately.
Scenario 2
Neighbor park reveals existing damage
Introduction:
Earlier analysis shows that these turbines have 16–18 years of life left. Additionally, the two existing turbines were built to design standard IC, which is a concern when adding new turbines.
This low design class means they may not handle extra turbulence well, leading to more curtailments and higher AEP losses.
So the key question is:
Can the planned turbines even be installed at all?
To answer that, we have added the available data—including the design classes of the existing turbines (see table)—to the lifetime optimization. This gives a clearer view of their remaining potential and limits.
The target lifetime for the planned new turbines remains 20 years, with a design class of IA. The binning approach remains unchanged.
Results
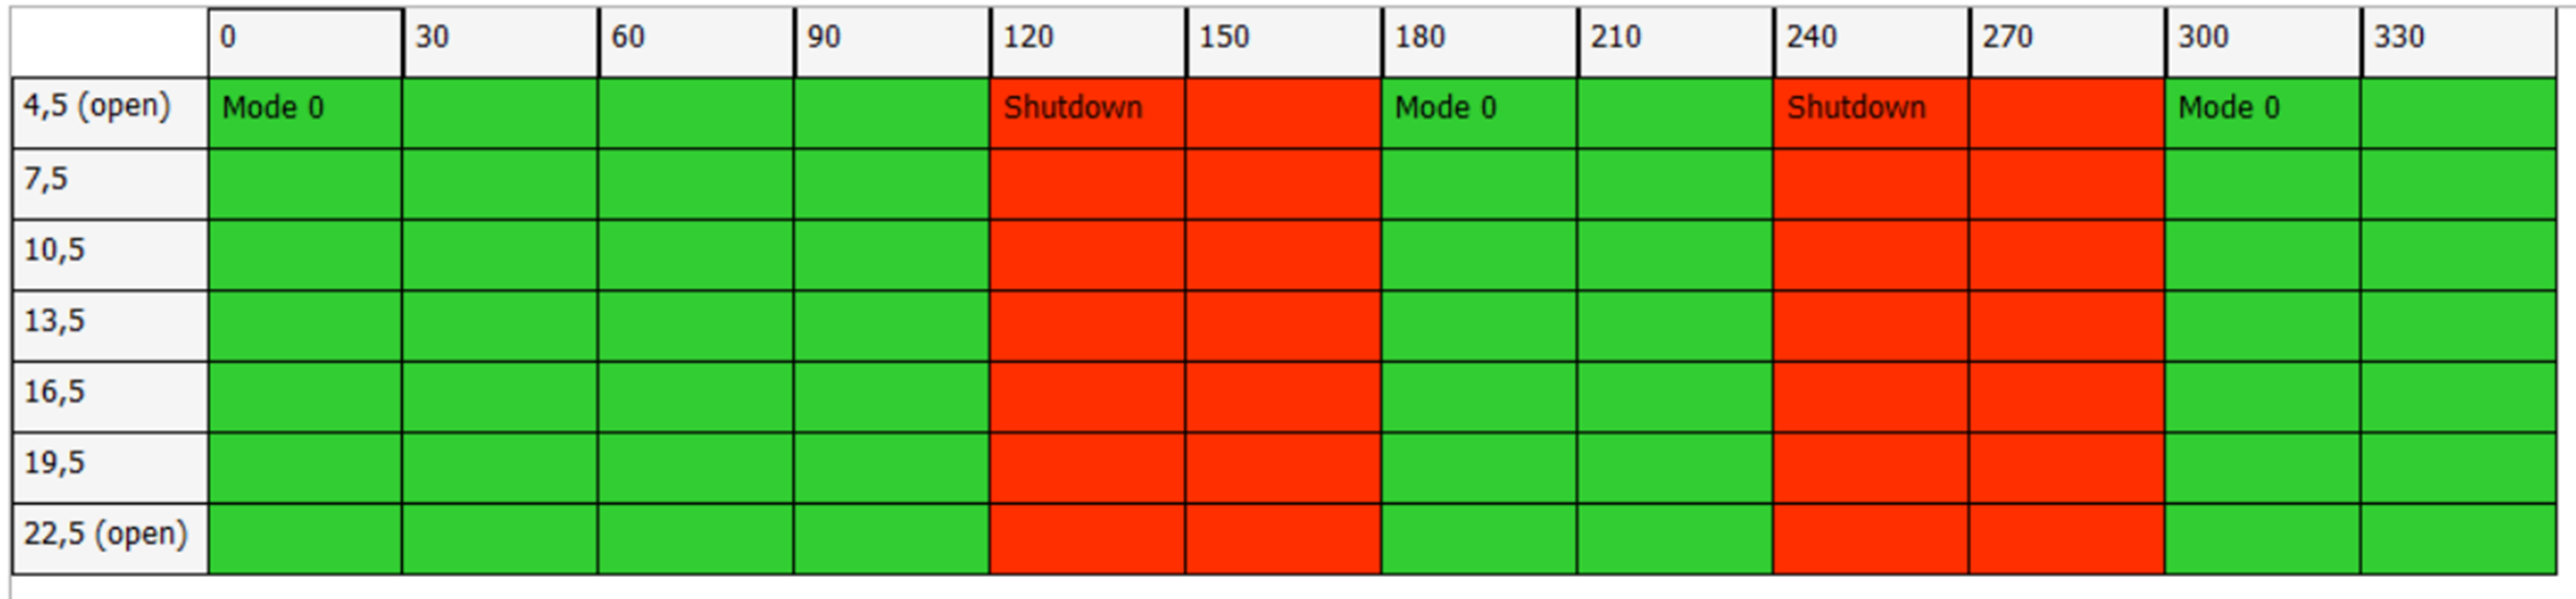
Only 7.1 years fatigue lifetime projected for E2
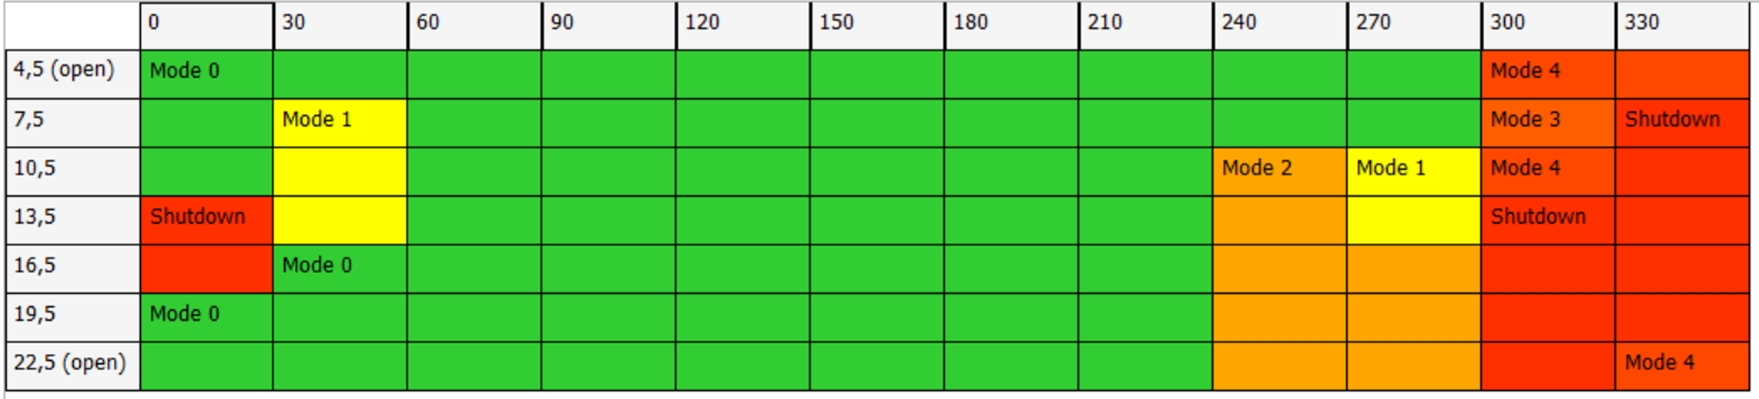
Turbine E2 is especially problematic. Without curtailment, it is projected to have only 7.1 years of fatigue life left - mainly because of its low design class (IC).
To extend its life to an acceptable level for the park owner, frequent shutdowns are needed to limit extra turbulence from other turbines (see Figure 4).
Surprisingly, though, a solution can still be found.
22% AEP loss because of the shutdowns
Unfortunately, these shutdowns result in significant annual energy production (AEP) losses—averaging 22% across all wind turbines and up to 38% for the planned new units.
Conclusion - windPRO's Optimizer steps in
The current turbines are built to a relatively low design class (IIB and IIC) and are located closely to the planned turbines, making them particularly susceptible to turbulence caused by wakes.
Although this issue is challenging to address, the Optimizer overcomes it by implementing optimized wind sector management. As a result, the new turbines can be approved for installation even within the highly restricted area.
Scenario 3
Binning was too fine to turbine operation in practice
Introduction: After reviewing the previously calculated curtailment schemes, the turbine manufacturer indicated that the original optimized curtailment matrices involved too many decision points, making implementation overly complex.
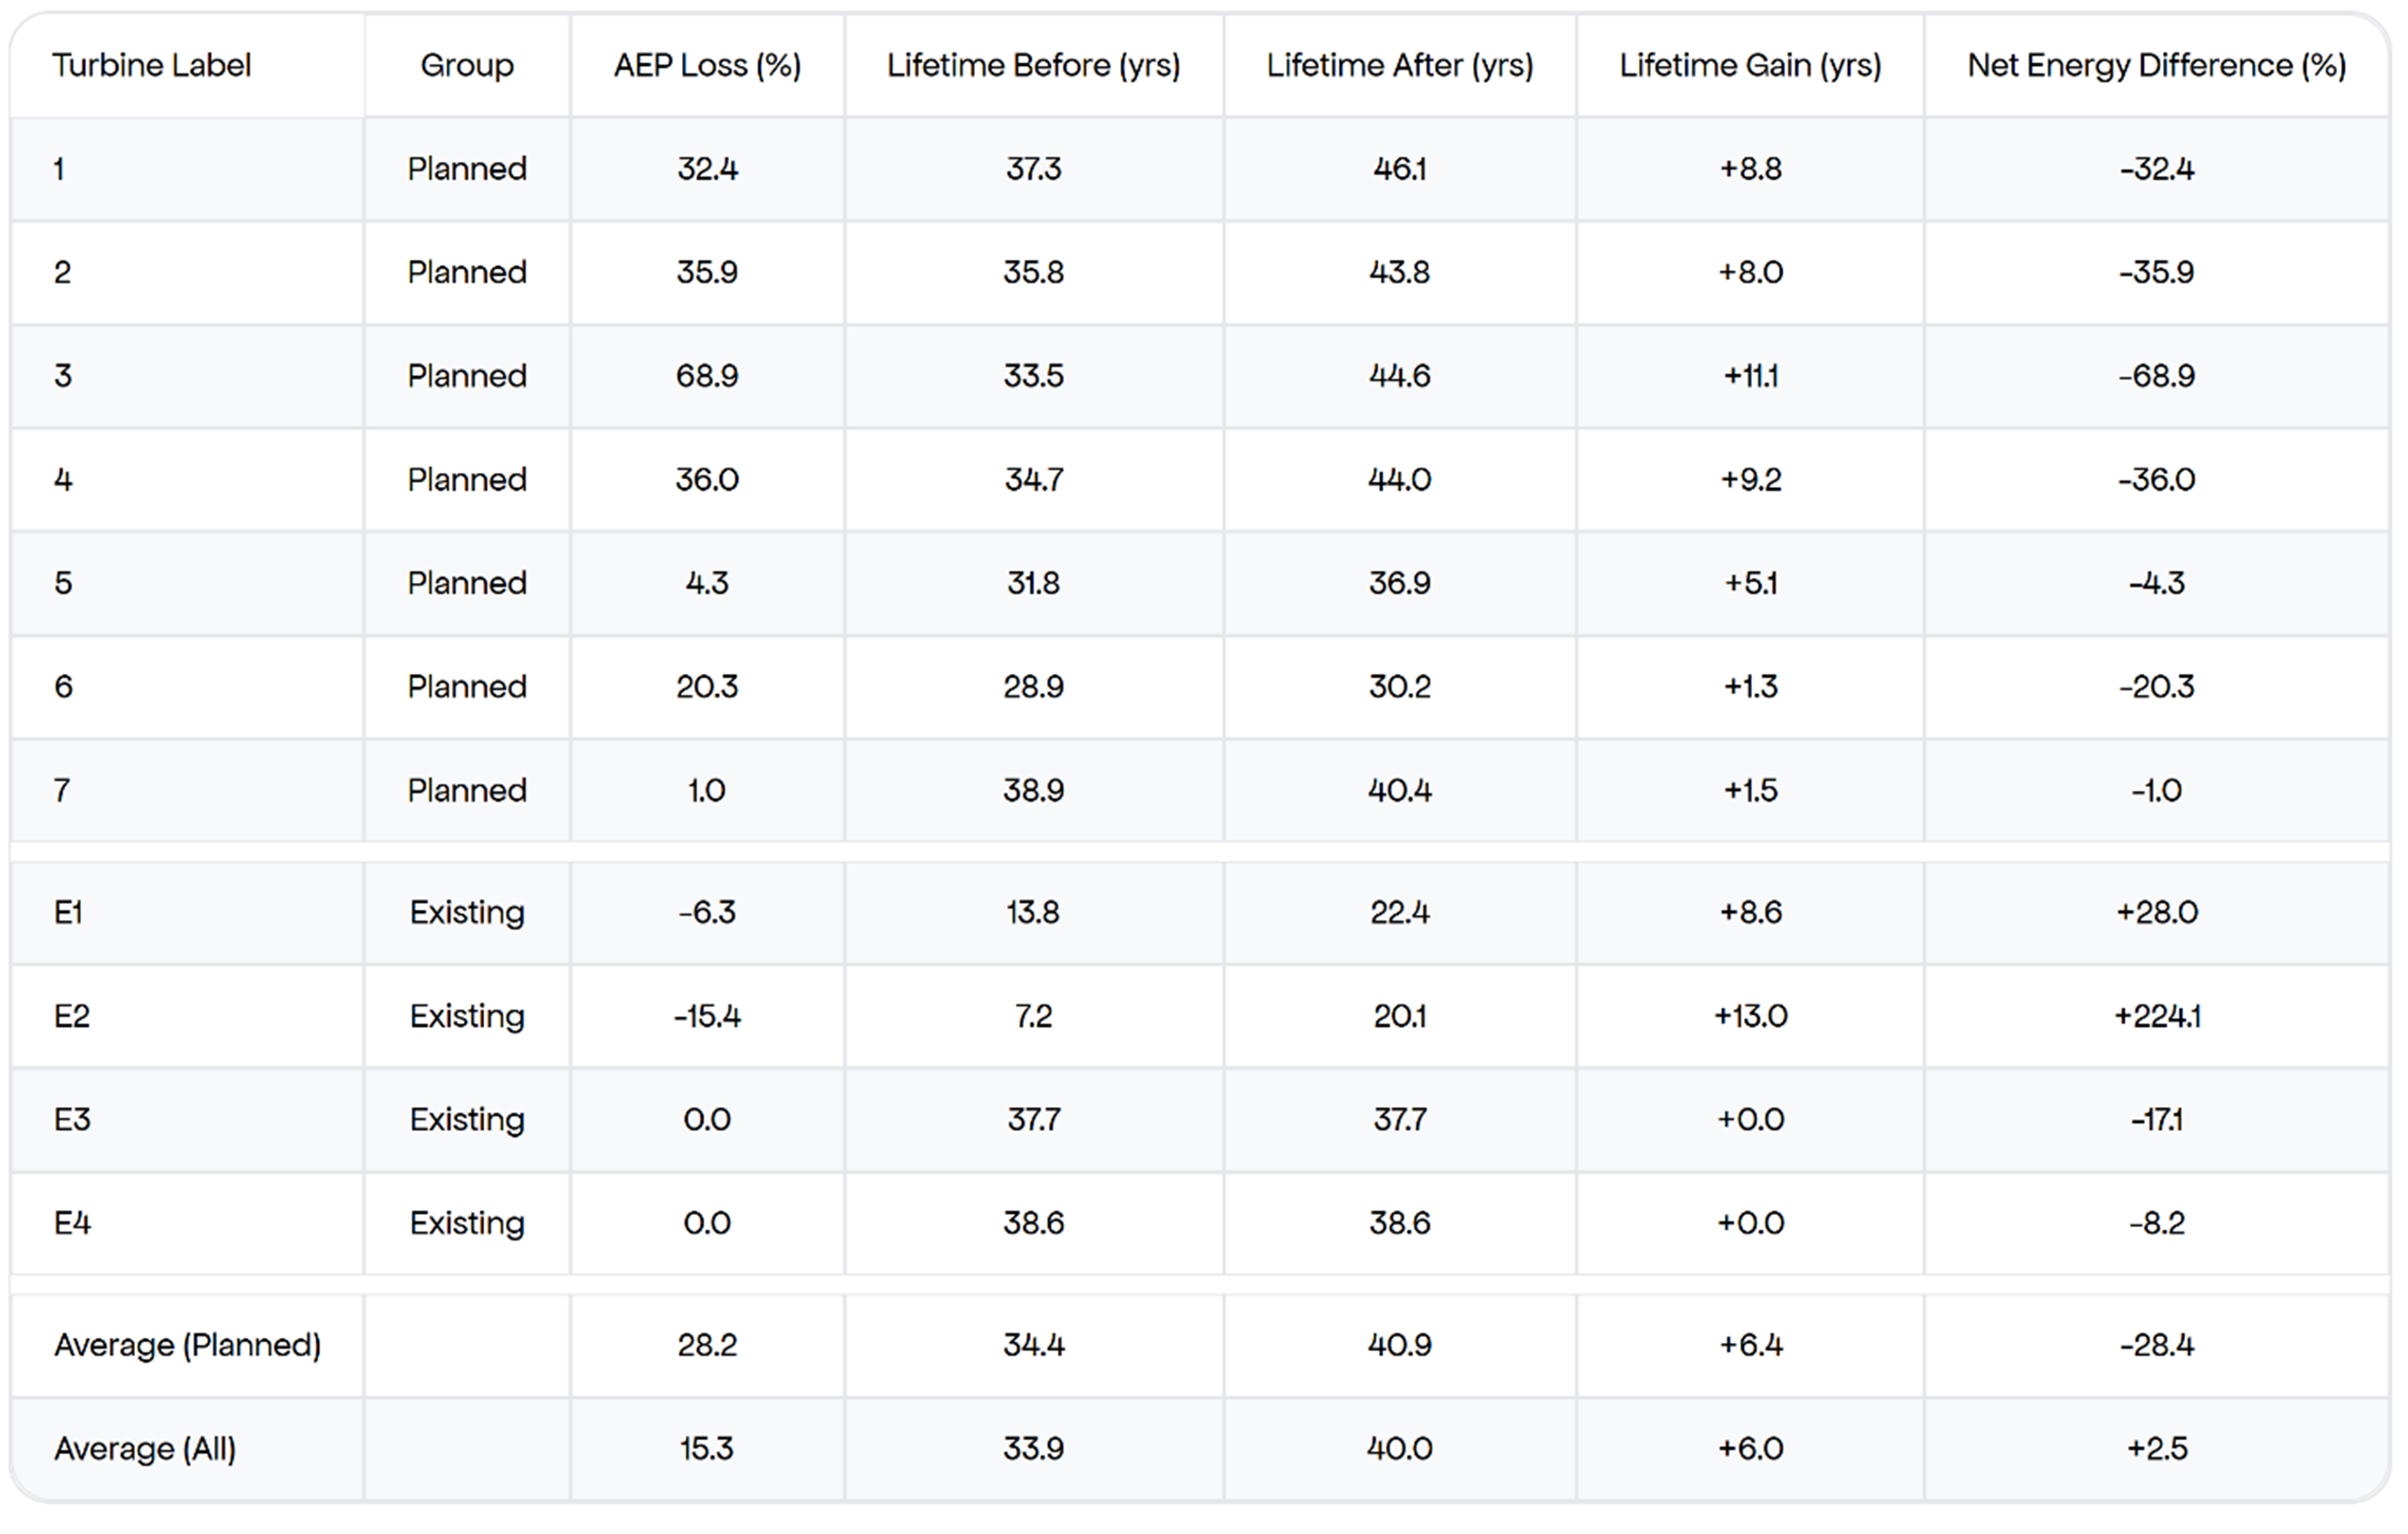
In response, the optimization was re-run using higher thresholds and a greater penalty for non-contiguous curtailment. This adjustment resulted in an additional 2% energy loss. However, the new approach is much more practical for real-world implementation:
The entire park can now be managed using just 15 curtailment rules
With these changes, the entire park can now be managed using just 15 curtailment rules. For example, one such rule could be: set turbine 4 to Shutdown mode for wind speeds between 4–25 m/s and wind directions from 45–75 degrees.
New strategy sumary
Fewer, more practical rules (15 vs. many)
AEP trade-off (+2.5%)
Example rule: Shutdown turbine 4 if wind speed 4–25 m/s and direction 45°–75°
There was an additional requirement with a maximum number of curtailment implementation rules from the turbine manufacturer.
As a result, the new turbines have a higher AEP loss but the plans can be implemented in practice.
Benefit
Easier implementation with minimal performance sacrifice.
windPRO’s Lifetime Optimizer gives you
Standard-compliant lifetime optimization
Smart curtailment planning
Better project financing confidence
Higher long-term energy yield—even with short-term AEP lossesThe modules you need
Your windPRO Training Hub
Dive into our comprehensive courses, webinars, and tutorials to master windPRO’s powerful features. Whether you’re a beginner or looking to refine your skills, our resources will help you unlock the full potential of your wind projects. Start learning today!
Courses relevant for this use case
- Introduction to windPRO
- Advanced Wind Resource Assessment
